How Reliable Is the T?
Needed Improvements to the MBTA’s Method for Measuring Subway Reliability on the Back on Track Performance Dashboard
HOW RELIABLE IS THE T? On its “Back on Track Performance Dashboard,” the MBTA publishes daily reliability ratings. How accurate are they? Despite customer satisfaction surveys that indicate over 40 percent of riders find the T to be unreliable, the reliability ratings consistently hover around 90 percent. This report recommends improvements to the method the MBTA uses to calculate reliability that will lead to more accurate ratings.
Executive Summary
How reliable is the T? Very relaible, according to the MBTA’s “Back on Track Performance Dashboard.” Not so reliable, according to commuters.
The Back on Track Performance Dashboard is an interactive website run by the MBTA that publicly reports data on four key performance areas: Reliability, Ridership, Customer Satisfaction, and Financials. It was rolled out shortly after the creation of the Fiscal and Management Control Board (“FMCB”), and is intended to provide the public with accessible and easy-to-understand ratings of the T’s services.
The Dashboard reports high reliability ratings for the subway and commuter rail and somewhat lower ratings for bus service. Bus service reliability is usually around 65-70 percent. Commuter rail service reliability usually hovers around or just under 90 percent. Subway reliability is typically the highest rated of all three and is usually at or above 90 percent.
Customers, however, do not rate the T’s reliability quite so high. The Dashboard reports that in June 2017, despite the Performance Dashboard’s report of high reliability percentages, 44 percent of those surveyed disagreed with the statement that “The MBTA Provides Reliable Public Transportation Services.” Another 19 percent only slightly agreed. Similarly, a recent poll of Boston area voters from WBUR/MassINC Polling Group found that 47 percent are dissatisfied with MBTA’s reliability. Although some deviation between customer perceptions of reliability and the MBTA’s metrics are to be expected, this large of a disconnect cannot be ignored.
This report takes a critical look at the unique methodology the MBTA uses to measure subway reliability and finds several problems that help explain the gap between the MBTA’s rating and customer satisfaction survey data. The report focuses on the subway, because it is the highest rated mode of service according to the MBTA’s Dashboard, it is the most widely used mode of service, and because the MBTA uses a unique methodology for measuring subway reliability, which it does not use for either the commuter rail or the bus.
Commuter rail reliability is measured by whether a train arrives to its destination less than five minutes later than it is scheduled to arrive. A reliable bus, when buses are scheduled every fifteen minutes or less, is one that departs and/or arrives no more than three minutes after the scheduled times. When buses are scheduled less frequently, a reliable bus is one that departs and/or arrives no earlier than one minute and no later than six minutes from the scheduled time.
Both of these methods have their own potential issues. Early buses are only counted as unreliable when there is less frequency, but these can still cause problems for riders during times of higher frequencies, especially when buses are scheduled fifteen minutes apart. The commuter rail methodology does not account for cancelled trains or in-station wait times.
This report, however, focuses on the MBTA’s methodology for measuring subway reliability. According to the MBTA Performance Dashboard website, reliability of the subway is “the percentage of people who waited the scheduled interval or less.” The MBTA calls this metric “Wait Time Reliability.”
Subway trains are scheduled on regular intervals, or “headways.” A headway is simply a measurement of the distance or time between vehicles in a transit system. Rather than measure subway reliability based on whether a train arrives within the scheduled headway, the MBTA measures reliability based on how long riders are waiting in the station. For example, assuming a five-minute headway, if a rider arrives at the station and waits five minutes or less, then the train is counted as “reliable” for that rider. As the below image demonstrates, this is true even if the train does not arrive within the five-minute headway. As the image also demonstrates, the same train in the same station can be both reliable and unreliable for the purposes of the MBTA’s calculation.
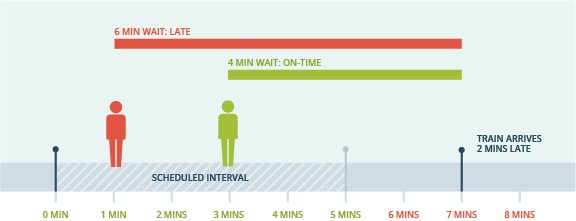
There are several problems with using this methodology to measure subway reliability. First, at a fundamental level, it conflates “headways” with “wait times.” Acceptable wait times for reliability purposes are defined based on the headways. However, if the MBTA meets its headway goals, wait times will be significantly lower than the actual headway. For example, assuming a five-minute headway, if riders arrived at the station at the same rate every minute, the average wait time would only be 2.5 minutes.
Second, by only measuring wait time, the MBTA’s subway methodology doesn’t actually account for on-time performance. A late train can be “reliable.” In fact, if in the above illustration riders arrived at the station at the same rate every minute, despite being late, the train would be counted as reliable for five out of every seven riders, and unreliable for only two out of every seven. Moreover, it assumes a reliable trip for riders who only waited a few minutes no matter what happens throughout the duration of their trip. Even if a rider waits a short time to get on a train, her trip still might take twice as long because of service disruptions, backups, or other issues along the way.
Third, the methodology does not account for overcrowding. It assumes that every rider can get on the first train that arrives after he or she gets to the station, which is often not the case during rush hour. This issue is compounded by equating the headways with acceptable wait times. And it is important to also recognize that longer headways themselves lead to more overcrowding, a longer wait time, and a worse customer experience.
To illustrate the problems with the MBTA’s Wait Time Reliability metric, this report compiles the text message alerts regarding delays and service interruptions on the Red Line sent out to subscribers between July 14 and July 26, 2017. These alerts are generated using the same real-time data collection used to generate the reliability ratings, but the alerts themselves are not considered by the MBTA’s methodology. Over the course of the two weeks, there were over forty alerts on the Red Line alone. The Dashboard reliability rating never dipped below 91 percent. There were days, however, with up to ten alerts. Days that had no alerts, like Sunday, July 23 (93 percent), had the same reliability percentage as days that had ten alerts, like Monday, July 24 (also 93 percent).
The comparison between the alerts and the reliability ratings highlights the problems with the MBTA’s methodology. It is confusing and incorporates only a portion of what riders think of when they think of reliability. Most importantly, it is not reflective of the rides customers are experiencing.
The FMCB was created to increase transparency and accountability and to improve customer service. The MBTA has taken steps in the right direction. But a reliability measurement that does not sufficiently reflect the actual reliability of MBTA services is not true transparency. Use of those numbers erodes public trust and confidence in the MBTA. Moreover, the Dashboard should be a tool for that the MBTA can use to identify issues and develop solutions. For it to be an effective tool, it must accurately reflect what is actually happening in the system.
The MBTA’s Wait Time Reliability metric fails in two fundamental ways. First, defining the acceptable wait time as equal to the headway is arbitrary at best and results in late trains that are counted as reliable. This leads to a high reliability rating, even when trains are not adhering to the scheduled headways. The MBTA needs to use a more appropriate metric for acceptable wait times. A logical choice would be half the headway, as that should be the average wait time when trains are on schedule. Second, by only measuring wait times, the MBTA’s metric fails to account for delays and service disruptions over the course of the journey, even though these affect riders’ overall experiences. A truly comprehensive reliability metric needs to account not only for wait times, but also for on-train time by factoring in delays and service disruptions.
There’s sometimes a disconnect between the data that the agencies collect for themselves and the data they present to the riders, and how they present it to the riders. For the most part, most riders don’t care about on-time performance, they don’t care about headways, they don’t care about terminal performance. They want to know how long it’s going to take them to get somewhere, when their train or bus is coming, and if there are any problems along the route.
Therefore, this report recommends changes to the reliability measurement reported on the Performance Dashboard that will mitigate some of the current limitations as well as present a metric that is more in line with how the average rider thinks about service. Specifically, the report recommends that the MBTA (1) revise the wait time metric to reflect that average wait times should be half the scheduled headway; (2) incorporate overall travel time, or excess journey time, into the reliability methodology; and (3) not use the metric for policy making decisions until it is further developed.
The MBTA is in a period of reform, and recently hired a General Manager who is focused on the riders’ experience and will be hiring a senior level manager dedicated to customer experience. Now is the perfect time for the agency to take a hard look at the Performance Dashboard, and revamp its methodology to more accurately measure what riders are experiencing.